Institutional-grade energy indices — built from first principles
Proprietary benchmarks tracking clean, fossil, and transition energy equities across Korea and the UK. Built on forward-looking classification methodology — not backward-looking revenue screens.
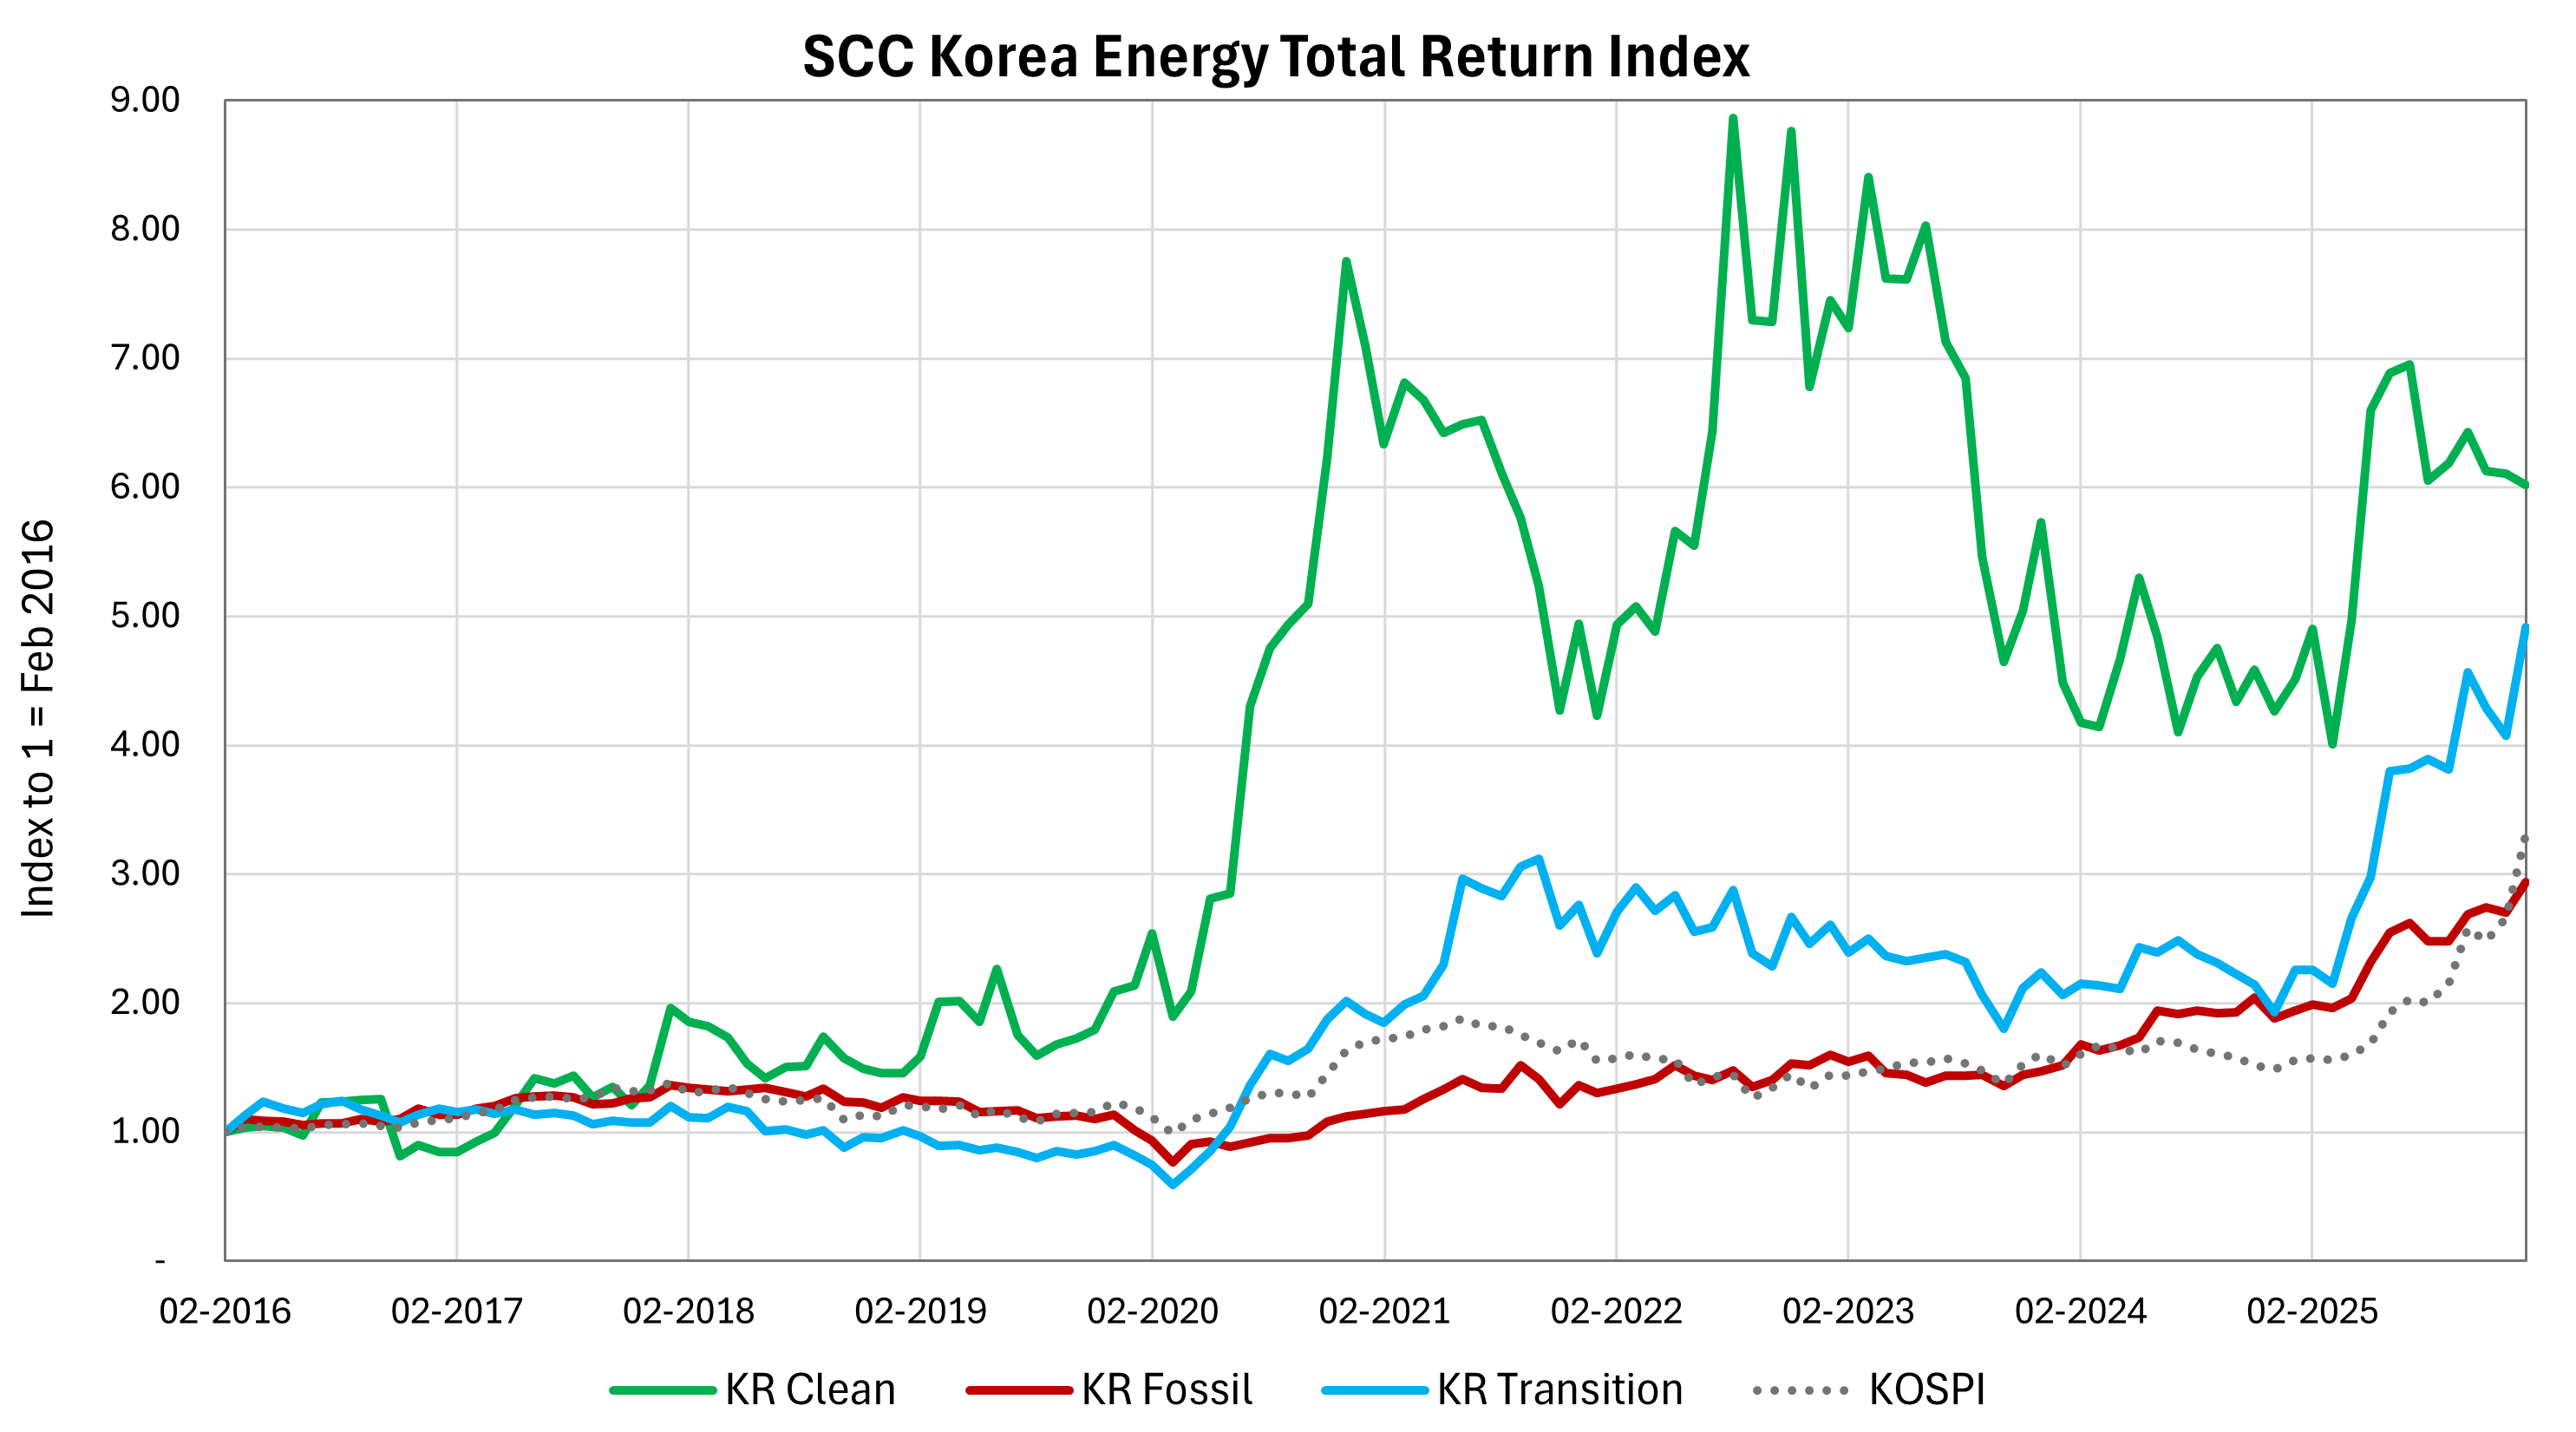
| Asset Correlation | KR Clean | KR Fossil | KR Transition | KOSPI |
|---|---|---|---|---|
| KR Clean | 1.00 | 0.47 | 0.79 | 0.64 |
| KR Fossil | 0.47 | 1.00 | 0.81 | 0.82 |
| KR Transition | 0.79 | 0.81 | 1.00 | 0.91 |
| KOSPI | 0.64 | 0.82 | 0.91 | 1.00 |
Based on 121 monthly observations (2016–2026).
| 1-Year | 3-Year | 5-Year | |
|---|---|---|---|
| Return | |||
| KR Clean | 72.6% | Subscription | Subscription |
| KR Fossil | 60.7% | Subscription | Subscription |
| KR Transition | 199.4% | Subscription | Subscription |
| Volatility | |||
| KR Clean | 50.8% | Subscription | Subscription |
| KR Fossil | 17.9% | Subscription | Subscription |
| KR Transition | 49.2% | Subscription | Subscription |
| Sharpe Ratio | |||
| KR Clean | 1.36 | Subscription | Subscription |
| KR Fossil | 3.19 | Subscription | Subscription |
| KR Transition | 3.98 | Subscription | Subscription |
Sharpe ratios use Korean 10-year government bond yield as risk-free rate. Equal-weighted constituents. Request full dataset →
Source: SCC Insight Analysis based on Koyfin Database · As of 20 February 2026
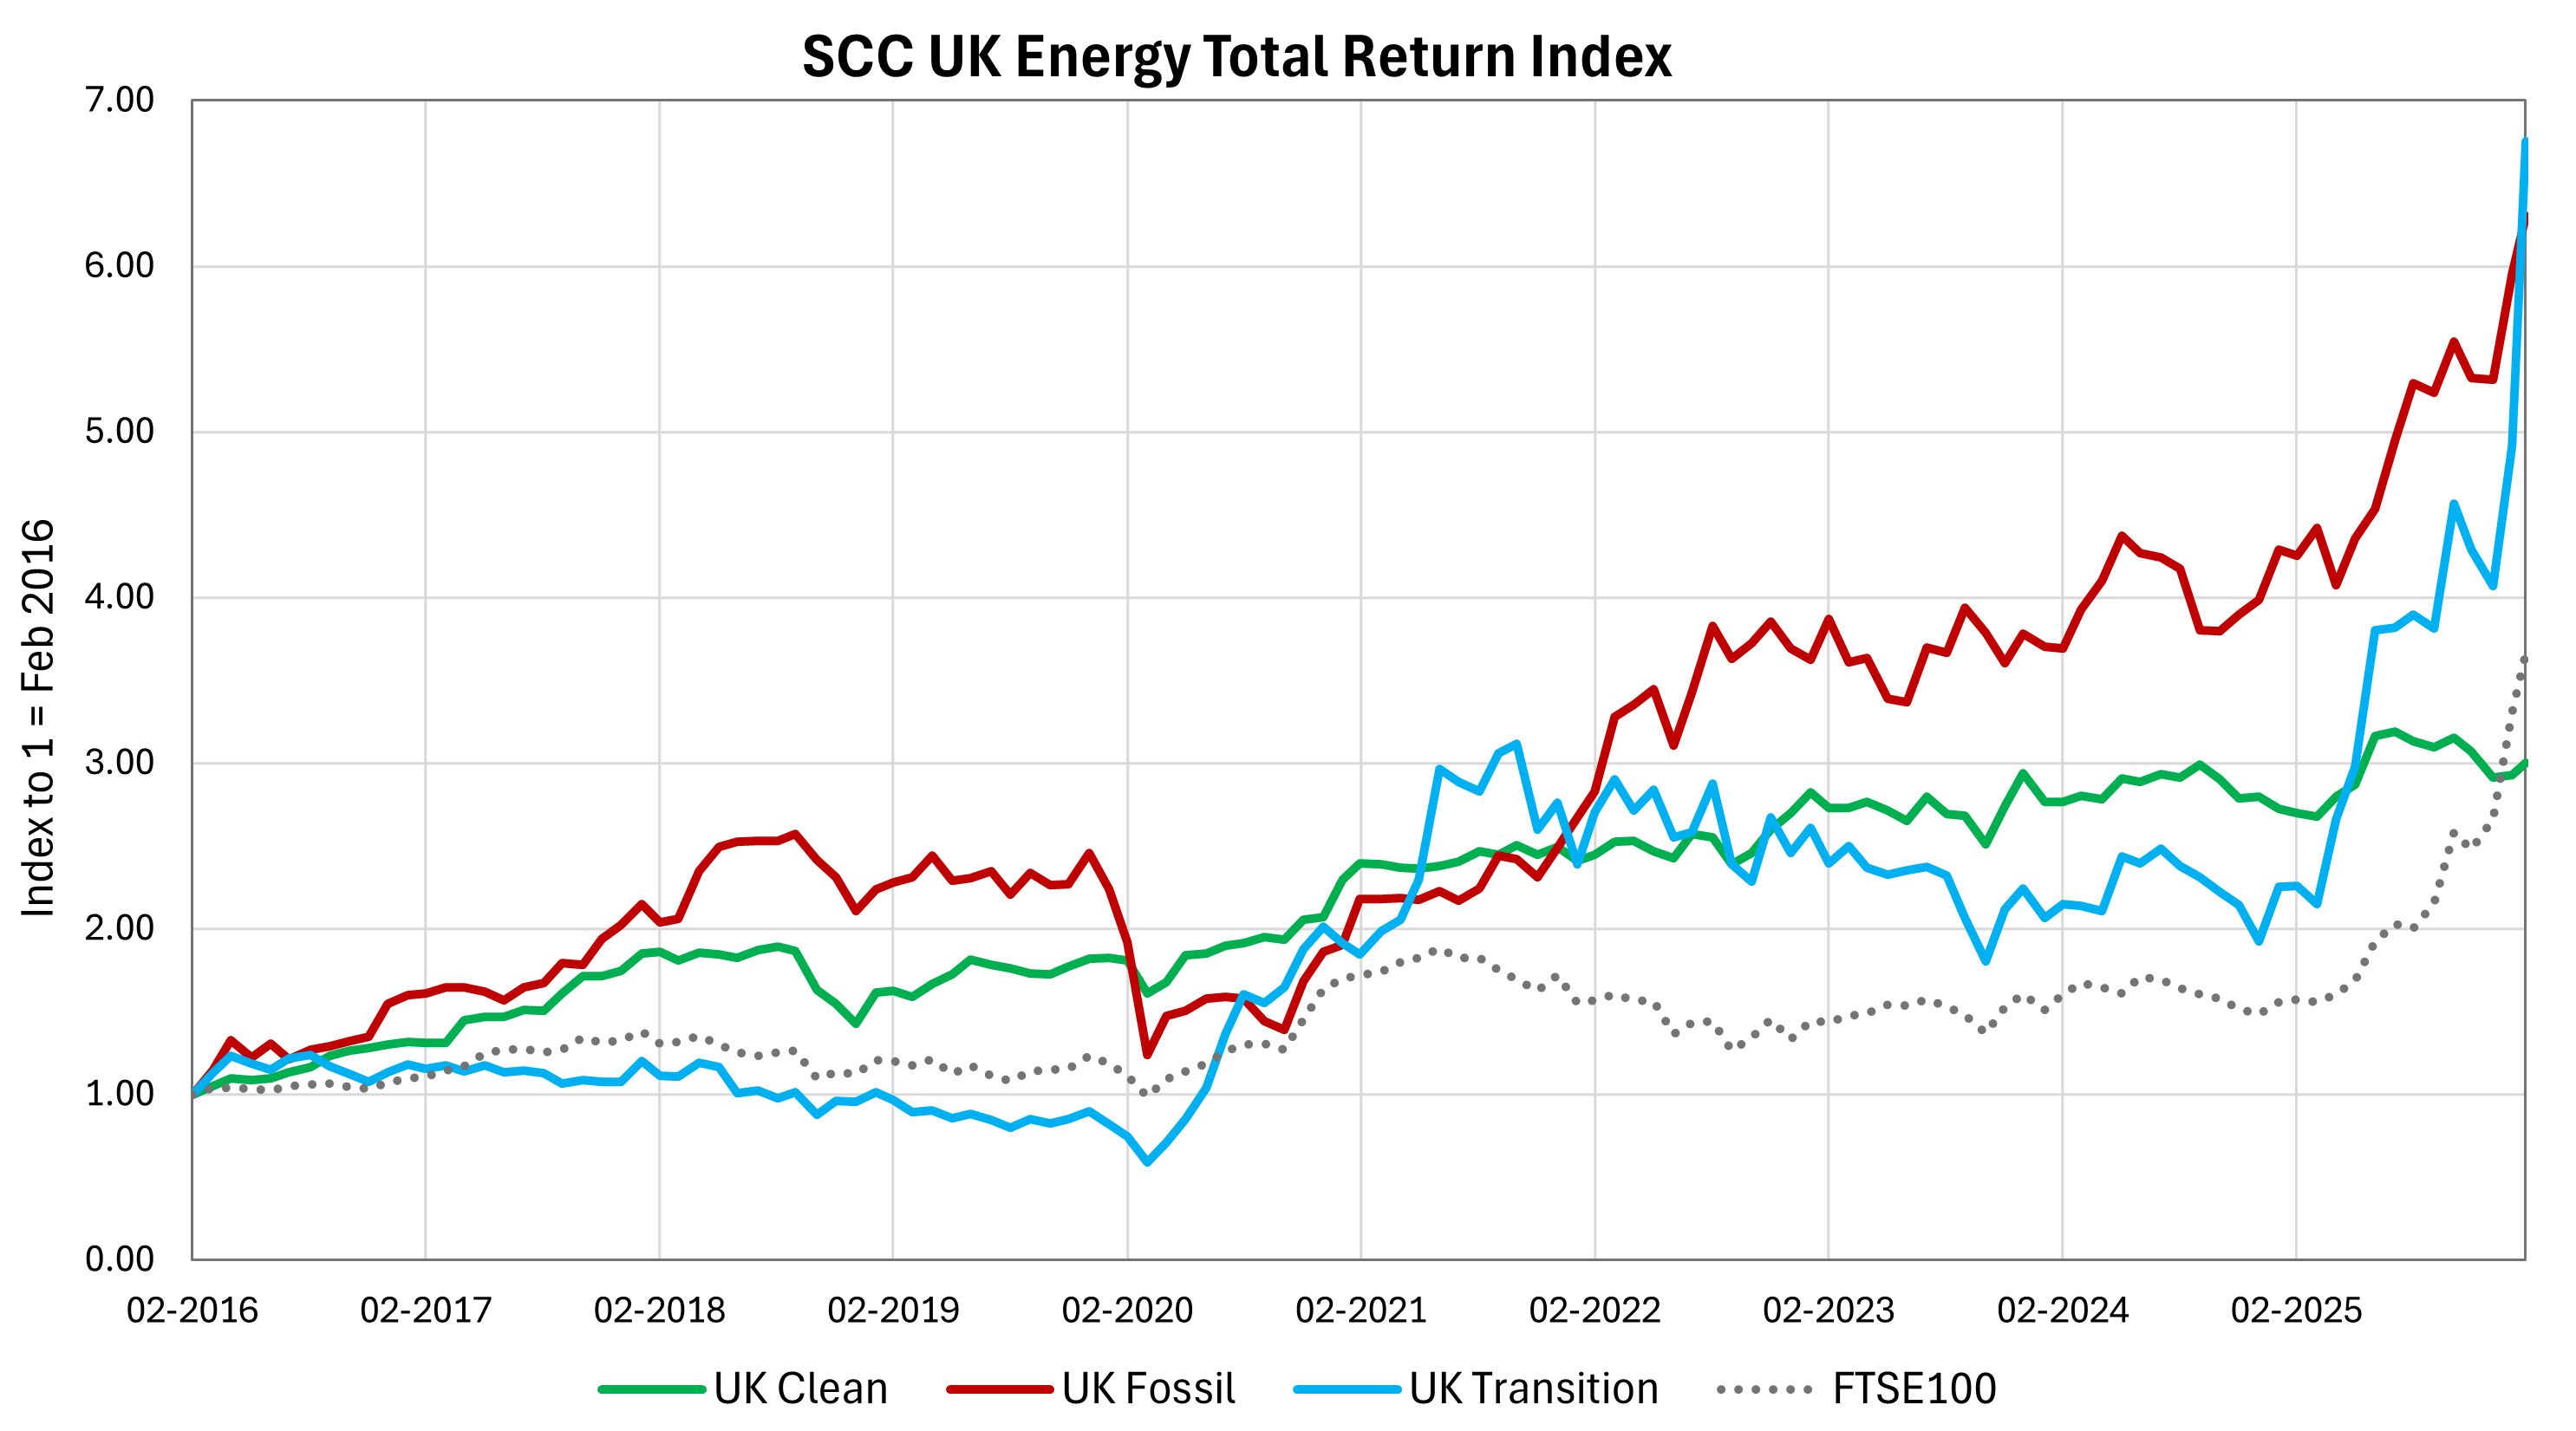
| Asset Correlation | UK Clean | UK Fossil | UK Transition | FTSE100 |
|---|---|---|---|---|
| UK Clean | 1.00 | 0.88 | 0.80 | 0.86 |
| UK Fossil | 0.88 | 1.00 | 0.78 | 0.97 |
| UK Transition | 0.80 | 0.78 | 1.00 | 0.73 |
| FTSE100 | 0.86 | 0.97 | 0.73 | 1.00 |
Based on 121 monthly observations (2016–2026).
| 1-Year | 3-Year | 5-Year | |
|---|---|---|---|
| Return | |||
| UK Clean | 10.2% | Subscription | Subscription |
| UK Fossil | 46.9% | Subscription | Subscription |
| UK Transition | 22.7% | Subscription | Subscription |
| Volatility | |||
| UK Clean | 13.1% | Subscription | Subscription |
| UK Fossil | 19.0% | Subscription | Subscription |
| UK Transition | 18.9% | Subscription | Subscription |
| Sharpe Ratio | |||
| UK Clean | 0.44 | Subscription | Subscription |
| UK Fossil | 2.24 | Subscription | Subscription |
| UK Transition | 0.97 | Subscription | Subscription |
Sharpe ratios use Korean 10-year government bond yield as risk-free rate. Equal-weighted constituents. Request full dataset →
Source: SCC Insight Analysis based on Koyfin Database · As of 20 February 2026
| Korea Market | KR Clean | KR Fossil | KR Transition | KOSPI |
|---|---|---|---|---|
| KR Clean | 1.00 | 0.47 | 0.79 | 0.64 |
| KR Fossil | 0.47 | 1.00 | 0.81 | 0.82 |
| KR Transition | 0.79 | 0.81 | 1.00 | 0.91 |
| KOSPI | 0.64 | 0.82 | 0.91 | 1.00 |
KR Clean shows the lowest correlation to KOSPI (0.64) among the three indices, suggesting it moves more independently from the broader Korean equity market. By contrast, KR Fossil and KR Transition exhibit higher KOSPI correlations of 0.82 and 0.91 respectively, indicating closer co-movement with general market conditions. More in-depth sectoral and country-level analysis is available upon request.
| UK Market | UK Clean | UK Fossil | UK Transition | FTSE100 |
|---|---|---|---|---|
| UK Clean | 1.00 | 0.88 | 0.80 | 0.86 |
| UK Fossil | 0.88 | 1.00 | 0.78 | 0.97 |
| UK Transition | 0.80 | 0.78 | 1.00 | 0.73 |
| FTSE100 | 0.86 | 0.97 | 0.73 | 1.00 |
UK energy indices show materially higher cross-asset correlations than Korea, potentially reflecting a more integrated market structure. Notably, UK Transition shows the lowest correlation to the FTSE100 (0.73), followed by UK Clean (0.86), while UK Fossil exhibits the highest at 0.97 — suggesting transition and clean energy indices have historically offered greater diversification benefits relative to the broader UK market than fossil energy constituents. More in-depth sectoral and country-level analysis is available upon request.
Based on 121 monthly observations (2016–2026). Request full cross-market correlation data →
Classification framework. Each company is mapped to the SCC taxonomy based on core business strategy, forward capex allocation, and R&D investment — not trailing revenue or historical ESG ratings. This forward-looking approach captures where capital is actually being deployed, not where it has been.
SCC Clean — Companies whose core business is renewables (wind, solar, hydro), clean fuels (including green hydrogen), or renewable energy equipment and services, with little to no fossil fuel exposure.
SCC Fossil — Companies whose core business revolves around oil & gas extraction, processing, transportation, fossil fuel power generation, or related equipment and services.
SCC Transition — Companies actively transitioning from fossil to cleaner energy, operating mixed fossil and renewable asset portfolios, or providing infrastructure and services that bridge the energy transition.
Unlike conventional ESG frameworks that rely on backward-looking revenue thresholds or third-party ratings, the SCC taxonomy is built on observed strategic intent — making it better suited to identifying genuine transition leaders and laggards. All indices are equal-weighted, eliminating large-cap concentration bias.